Joseph Smidt
2009-07-29 01:34:43 UTC
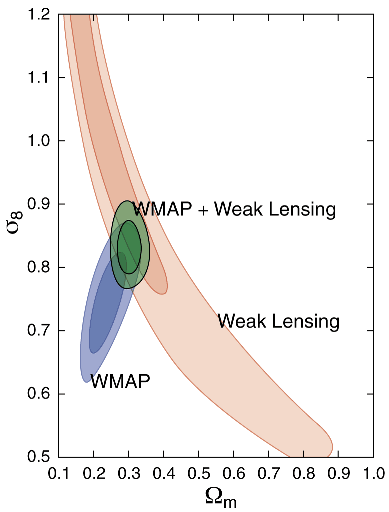
I have a function on a 2d grid that looks like a skewed mound. I would
like to calculate everything in the 68% (one sigma or standard
deviation) confidence interval, and 95% (two sigma) as seen done in
this plot: Loading Image... .
.
(The first line is 68% and second line is 95% confidence intervals.)
I would like to the set everything in the 68% confidence interval to
1, 95% to 2 and everything else to 0. Thanks.
Joseph Smidt
like to calculate everything in the 68% (one sigma or standard
deviation) confidence interval, and 95% (two sigma) as seen done in
this plot: Loading Image...
 .
.(The first line is 68% and second line is 95% confidence intervals.)
I would like to the set everything in the 68% confidence interval to
1, 95% to 2 and everything else to 0. Thanks.
Joseph Smidt
--
------------------------------------------------------------------------
Joseph Smidt <***@gmail.com>
Physics and Astronomy
4129 Frederick Reines Hall
Irvine, CA 92697-4575
Office: 949-824-3269
------------------------------------------------------------------------
Joseph Smidt <***@gmail.com>
Physics and Astronomy
4129 Frederick Reines Hall
Irvine, CA 92697-4575
Office: 949-824-3269